Ransomed — Malware Analysis Walkthrough
Dynamic analysis and memory forensics: stack-strings, API resolution, shellcode and process hollowing.
Overview
| Platform | CyberDefenders |
| Category | Malware Analysis |
| Difficulty | Hard |
| Focus | Dynamic Analysis · Process Hollowing · String Obfuscation · API Resolution |
| Lab Link | Ransomed |
The Ransomed challenge is a malware analysis lab that simulates a real-world incident where suspicious memory activity is detected on a workstation. Initial telemetry points to an unknown executable exhibiting high entropy, a common indicator of packing or obfuscation.
At first glance, the binary does not immediately reveal its intent through static inspection alone. Instead, its true behavior unfolds only at runtime — where memory allocation, shellcode execution, and process manipulation become visible.
This challenge is not about signature matching or quick wins. It is about reconstructing execution flow, understanding why specific Windows APIs are used, and recognizing how common malware techniques appear in practice.
Objective
The goal of this analysis is to reconstruct the malware’s execution chain using a combination of:
- Static analysis (PE structure, entropy, sections)
- Dynamic analysis (debugging, API tracing)
- Behavioral reasoning (what each action enables next)
By the end of the investigation, we aim to clearly answer:
- How the malware unpacks itself
- How it hides strings and resolves APIs dynamically
- How it executes shellcode
- How it injects a payload into another process
- What specific process injection technique is used
Tools Used
Throughout this analysis, the following tools are used:
- PE inspection tools (entropy, sections, headers)
- Disassembler (static code inspection)
- x32 debugger (runtime behavior, API tracing)
- Shellcode debugger/emulator (when needed)
Q1 — Entropy Analysis & Initial Triage
Question
What is the value of entropy?
How entropy works
Entropy measures randomness of bytes:
- Low entropy (~3–5): readable data, strings, code
- High entropy (~7+): encrypted / packed / compressed
Windows executables that are clean and unpacked rarely sit close to 8.
So when entropy is high, static analysis alone will lie to you.
What we do here
We inspect the binary using a PE analysis tool (PEStudio / DIE / similar) and check:
- Overall file entropy
- Whether entropy is uniform or concentrated
- Whether it aligns with later behavior (unpacking, shellcode, etc.)
This tells us how much trust to put in static findings.
The First Page of the PEStudio show us :
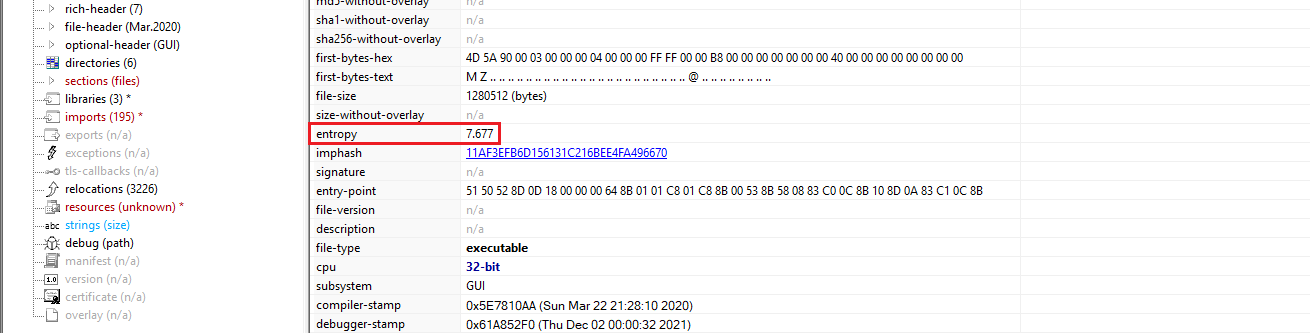 PEStudio showing entropy value of 7.677
The entropy value observed is:
1
7.677
An entropy value of 7.677 is very high and strongly suggests:
- The binary is packed or obfuscated
- Payload is likely unpacked at runtime
- Static strings and imports will be incomplete or misleading
This immediately justifies:
- Debugging
- Memory analysis
- Runtime API tracing
At this point, any analyst who continues purely statically is already behind.
Q2 — Section Analysis
Question
What is the number of sections?
What we look for
From the same utility we used firt, PEStudio we’ll select the section tab and we’ll see :
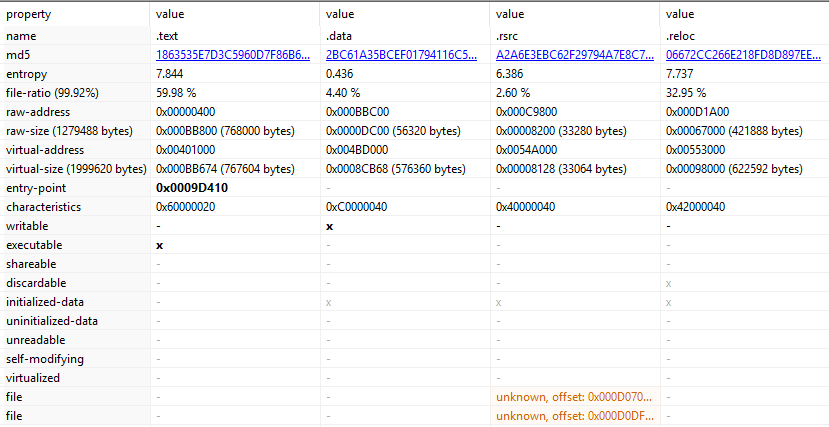 Four sections: .text, .data, .rsrc, .reloc
we noticed four sections : .text, .data, .rsrc, .reloc so the binary contains:
1
4 sections
So here’s the key insight:
The malware does not rely on exotic sections to hide. It relies on runtime behavior.
This aligns perfectly with what entropy already told us:
- Code and payload are likely unpacked dynamically
- Strings and APIs may not exist in plaintext on disk
This is an important lesson for readers:
- Normal structure ≠ benign behavior
Q3 — String Obfuscation Technique
Question
What is the name of the technique used to obfuscate string?
At this stage we know:
- Entropy is high → something is hidden
- Sections look normal → hiding is logical, not structural
So the next question is:
Where are the strings?
And the answer is:
- Not in
.rdata - Not visible via static string extraction
- Constructed at runtime
This immediately narrows it down to:
- Stack strings
- Heap strings
- Decryption routines
So we open IDA.
What we look for in IDA
In IDA, stack strings look like this:
- No readable string in
.rdata Instead:
- Multiple
mov,push,xor,add - Writing single bytes / dwords
- To
[esp+X]or[ebp-X]
- Multiple
Then passing a pointer to:
GetProcAddressLoadLibraryA- or another API
The string never exists as a contiguous string in the binary.
Look at this part from IDA (exactly +0x9bee0) :
1
2
3
4
5
6
7
8
9
10
11
12
13
// Sets up memory protection - gets VirtualProtect address and marks decrypted memory region as executable (PAGE_EXECUTE_READWRITE).
int setup_virtual_protect()
{
  _BYTE v1[4]; // [esp+4h] [ebp-4h] BYREF
  strcpy(g_api_name_buffer, "kernel32.dll");
  g_kernel32_handle = (int)GetModuleHandleA(g_api_name_buffer);
  strcpy(g_api_name_buffer, "VirtualProtect");
  g_VirtualProtect_addr = (int)GetProcAddress((HMODULE)g_kernel32_handle, g_api_name_buffer);
  return ((int (__stdcall *)(int, SIZE_T, int, _BYTE *))g_VirtualProtect_addr)(
           g_decrypted_code_ptr,
           g_junk_condition,
           64,
           v1);
- Strings are not stored in plaintext in the binary
- They are built byte-by-byte or dword-by-dword
- Construction happens on the stack
- The buffer is used immediately and often wiped later
- This defeats:
strings.exe- static YARA rules
- naive reverse engineering This is a classic malware evasion technique.
This technique is known as stack strings.
By constructing strings dynamically on the stack, the malware effectively evades static string analysis tools and signature-based detection. This behavior is commonly observed in real-world malware and aligns with the high entropy observed earlier.
Q4 — Memory Allocation for Shellcode
Question
What is the API that used malware-allocated memory to write shellcode?
At this point in the analysis, we already know:
- The malware hides strings using stack strings
- APIs are resolved dynamically
- Static analysis alone is unreliable
So the next logical question is:
Where does the decrypted or unpacked payload live in memory?
Malware that unpacks itself must allocate memory to:
- Store decrypted code
- Change permissions
- Transfer execution
So we are now looking for memory allocation APIs.
What we look for in IDA
Inside IDA, we search for:
- Calls to memory management APIs
Especially APIs related to:
- Allocation
- Protection changes
- Execution
Typical candidates include:
VirtualAllocVirtualAllocExHeapAllocNtAllocateVirtualMemory
Because APIs are resolved dynamically, we don’t rely on imports. Instead, we follow GetProcAddress usage and observe how the returned function pointers are used.
Evidence from the code
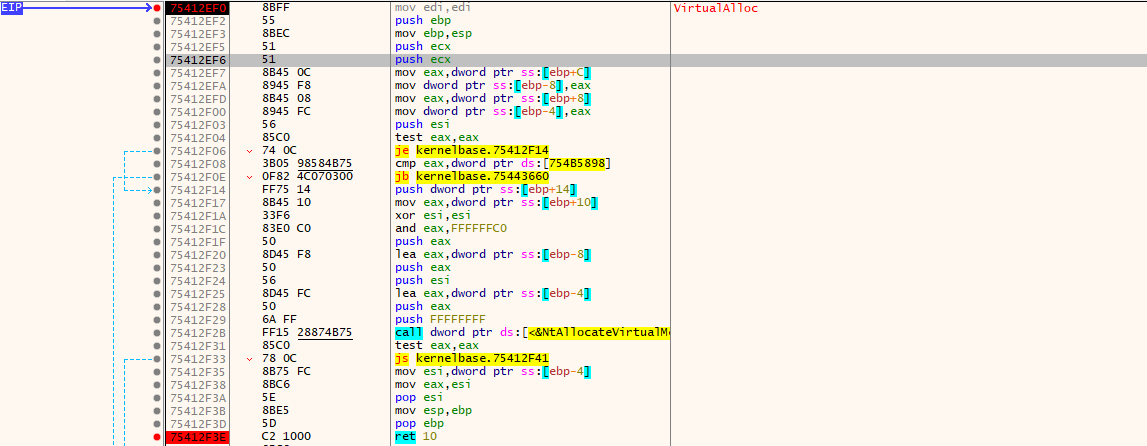
From the earlier analysis, we already identified dynamic resolution of VirtualProtect. Tracing backward and forward in the code reveals that memory is allocated prior to execution and decryption routines. we can demostrate that by just setting a breakpoint at the VirtualAlloc Call in the debugger.
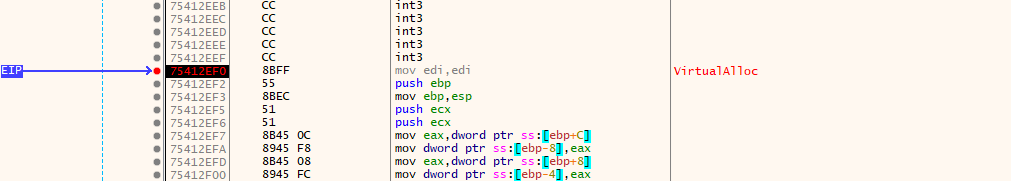 Breakpoint set at VirtualAlloc in x32dbg
The API used by the malware to allocate memory for writing shellcode is:
1
VirtualAlloc
This API is used to reserve and commit memory regions that later hold decrypted shellcode.
This is a prerequisite for:
- Shellcode execution
- Process injection
- Unpacking routines
At this stage, allocation alone does not prove injection — but it confirms that runtime code generation/execution is happening.
This finding fits naturally into the execution chain we are reconstructing and prepares us for the next critical step: memory permissions.
Q5 — Memory Protection of Allocated Region
Question
What is the protection of allocated memory?
Allocating memory alone is not enough to execute shellcode.
For code to run, the memory must be:
- Executable
- And usually Writable during decryption/unpacking
So after identifying VirtualAlloc, the next question is obvious:
What permissions does the malware assign to that memory?
This tells us:
- Whether the memory is intended for code execution
- Whether the malware follows a decrypt-then-execute pattern
What we look for
In IDA, we inspect:
- The arguments passed to the resolved allocation/protection API
- Especially the protection constant
Typical values to watch for:
| Value | Meaning |
|---|---|
0x04 | PAGE_READWRITE |
0x20 | PAGE_EXECUTE_READ |
0x40 | PAGE_EXECUTE_READWRITE |
Malware very often uses 0x40 because it allows:
- Writing decrypted payload
- Executing it immediately afterward
Evidence from the code
From the previously identified routine:
1
2
3
4
5
6
((void (__stdcall *)(char *, int, int, _DWORD *))(v10 + v11))(
    ImageBaseAddress + 1814528,
    196608,
    64,
    v14
);
The third argument passed is:
1
64
In hexadecimal:
1
0x40
Which corresponds to:
1
PAGE_EXECUTE_READWRITE
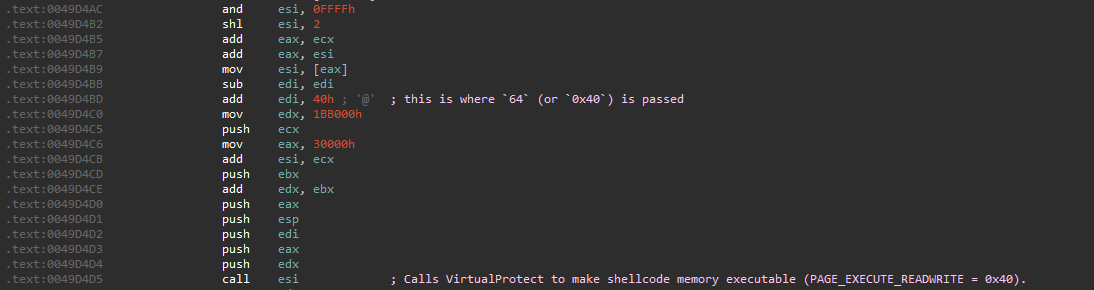 Value 0x40 (PAGE_EXECUTE_READWRITE) passed as protection
The protection of the allocated memory is:
1
ERW (PAGE_EXECUTE_READWRITE)
This confirms that the allocated region is intended to store and execute shellcode, not just data.
Q6 — Transfer of Execution to Shellcode
Question
What assembly instruction is used to transfer execution to the shellcode?
From previous questions, we already know:
VirtualAllocis used to allocate memory- The memory protection is PAGE_EXECUTE_READWRITE
- Shellcode is written into that region
But allocation is not execution.
So the correct next step is:
Trace execution immediately after
VirtualAllocreturns and observe how the allocated address is used.
This requires a debugger.
Dynamic Analysis Setup
At runtime, we set a breakpoint on:
1
kernel32!VirtualAlloc
 Breakpoint hit at VirtualAlloc
Once the breakpoint hits:
- Step out of
VirtualAlloc - Observe the return value
- Follow how the program uses that pointer
btw the return value of VirtualAlloc is critical — it is the base address of the shellcode.
What happens after VirtualAlloc returns
After stepping a few instructions, we observe the following workflow:
- The return value of
VirtualAllocis saved on the stack (typically into a local variable[ebp-4]) The malware performs additional setup:
- Writes/decrypts data into the allocated memory
- Prepares execution context
- Execution is indirectly transferred to the allocated region
This confirms that the allocated memory is an executable payload.
After tracing execution, the final control transfer is done via:
1
jmp dword ptr ss:[ebp-4]
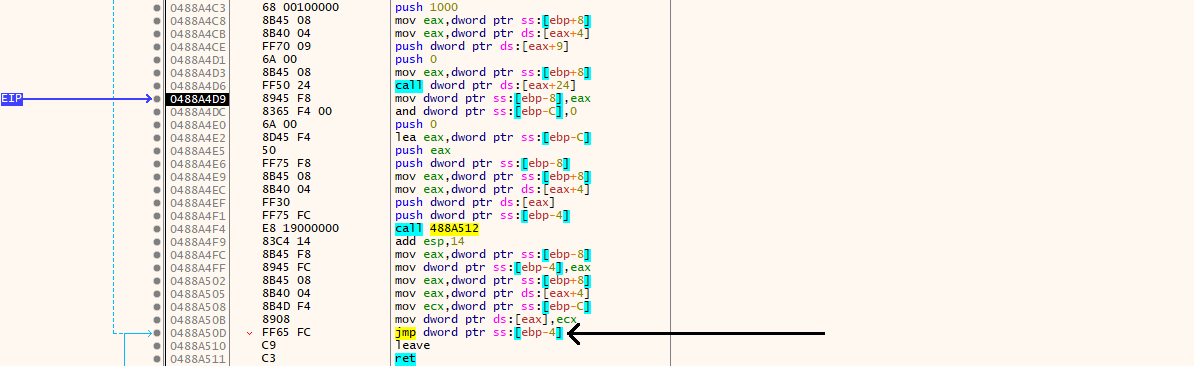 Indirect jump transferring execution to shellcode
This instruction:
- Reads the address returned by
VirtualAlloc - Redirects execution to that memory region
- Hands control directly to the shellcode
There is no function call, no symbol, and no import involved.
Note that by using an indirect jump via the stack:
- Avoids direct calls to suspicious addresses
- Makes static control-flow analysis harder
- Cleanly separates loader code from payload code
The assembly instruction used to transfer execution to the shellcode is:
1
jmp dword ptr ss:[ebp-4]
Q7 — Dynamic API Resolution (kernel32)
Question
What is the number of functions the malware resolves from kernel32?
From the previous questions, we already proved:
- Shellcode is allocated with
VirtualAlloc - Memory is executable
- Execution jumps into the payload
At this point, IDA is no longer enough.
To answer this cleanly and reliably, we extract the payload and analyze it independently.
Locate the payload in memory
We break on the return of VirtualAlloc:
1
75412F3E | C2 1000 | ret 10
After the return:
EAXcontains the base address of the allocated memory
Observed value:
1
EAX = 0x04990000
At this moment, the memory is empty — expected, since the payload has not been copied yet.
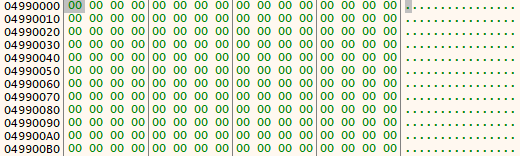 Memory at allocated address is empty before payload copy
After stepping forward a few instructions, the payload is written into that region.
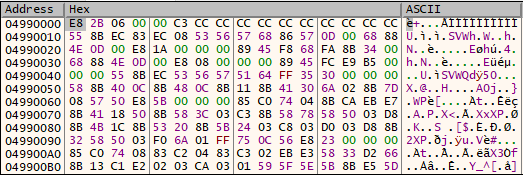 Payload written to allocated memory region
- Payload confirmed at address
0x04990000.
Dump the payload from memory
The allocation size passed to VirtualAlloc is:
1
0x0011B000
We dump the payload using x32dbg:
1
savedata payload.bin, 04990000, 0011B000
Now we have the raw shellcode payload extracted from memory.
Analyze the payload with scdbg
We load the dumped payload into scdbg and search for resolved APIs:
1
scdbg.exe /f payload.bin /findsc
scdbg identifies the shellcode entry point and begins emulation. After selecting the correct entry index, the resolved APIs are displayed.
Identify kernel32-resolved functions
From the scdbg output, the payload resolves APIs from multiple modules:
1
2
3
4
5
6
7
8
9
10
11
12
13
14
15
16
17
4017fa  LoadLibraryA(kernel32)
401831  GetProcAddress(WinExec)
40189f  GetProcAddress(CreateFileA)
4018de  GetProcAddress(WriteFile)
40194c  GetProcAddress(CloseHandle)
4019cf  GetProcAddress(CreateProcessA)
401a60  GetProcAddress(GetThreadContext)
401ad5  GetProcAddress(VirtualAlloc)
401b58  GetProcAddress(VirtualAllocEx)
401bc6  GetProcAddress(VirtualFree)
401c5e  GetProcAddress(ReadProcessMemory)
401cfd  GetProcAddress(WriteProcessMemory)
401d8e  GetProcAddress(SetThreadContext)
401e03  GetProcAddress(ResumeThread)
401ea9  GetProcAddress(WaitForSingleObject)
401f0c  GetProcAddress(GetModuleFileNameA)
401f96  GetProcAddress(GetCommandLineA)
We focus only on APIs resolved via kernel32. Counting the GetProcAddress calls targeting kernel32. The malware dynamically resolves:
1
16 functions from kernel32.dll
Q8 — Strings Obfuscated After RegisterClassExA
Question
The malware obfuscates two strings after calling RegisterClassExA. What is the first string?
Runtime setup
At this stage, static analysis is useless for strings.
We know that RegisterClassExA forces plaintext strings, so the correct move is:
Set a breakpoint on:
1
user32!RegisterClassExA
- Let execution stop at the function entry
- Inspect the stack arguments before the call executes
At the breakpoint, execution stops at:
1
2
3
4
5
6
7
8
9
10
11
12
13
755779F0 | 8BFF                   | mov edi,edi                             |
755779F2 | 55                     | push ebp                                |
755779F3 | 8BEC                   | mov ebp,esp                             |
755779F5 | 8B4D 08                | mov ecx,dword ptr ss:[ebp+8]            |
755779F8 | 8339 30                | cmp dword ptr ds:[ecx],30               |
755779FB | 0F85 0E260500          | jne user32.755CA00F                     |
75577A01 | 6A 01                  | push 1                                  |
75577A03 | 68 80000000            | push 80                                 |
75577A08 | 6A 00                  | push 0                                  |
75577A0A | 33D2                   | xor edx,edx                             |
75577A0C | E8 BC100400            | call user32.755B8ACD                    |
75577A11 | 5D                     | pop ebp                                 |
75577A12 | C2 0400                | ret 4                                   |
This confirms we are inside RegisterClassExA, before any processing happens.
Inspecting the stack
At the breakpoint, the stack layout is:
1
2
3
4
5
[esp+4]  = 007EB85C
[esp+8]  = 646F6173
[esp+0C] = 6F6E666B
[esp+10] = 75396173
[esp+14] = 00006E69
Interpreting these DWORDs as ASCII (little-endian):
1
73 61 6F 64 6B 66 6E 6F 73 61 39 75 69 6E
Which decodes to:
1
saodkfnosa9uin
Following the pointer confirms the same string in memory:
 Stack revealing the obfuscated string at runtime
After RegisterClassExA returns:
- This memory region is modified
- The string is overwritten / obfuscated
- The plaintext string no longer exists in memory
This confirms:
- Runtime string decryption
- API-forced exposure
- Immediate cleanup to evade memory inspection
The first string that is revealed and then obfuscated after calling RegisterClassExA is:
1
saodkfnosa9uin
This string exists only briefly at runtime, which is exactly why breaking on the API is the correct approach.
Q9 — CreateProcessA & dwCreationFlags
Question
What is the value of dwCreationFlags of CreateProcessA?
Runtime breakpoint
At this stage, the malware is about to spawn a new process. We set a breakpoint on:
1
kernel32!CreateProcessA
Execution stops inside the API wrapper, right before the call is forwarded to CreateProcessInternalA:
1
754993E7 | call kernelbase.CreateProcessInternalA
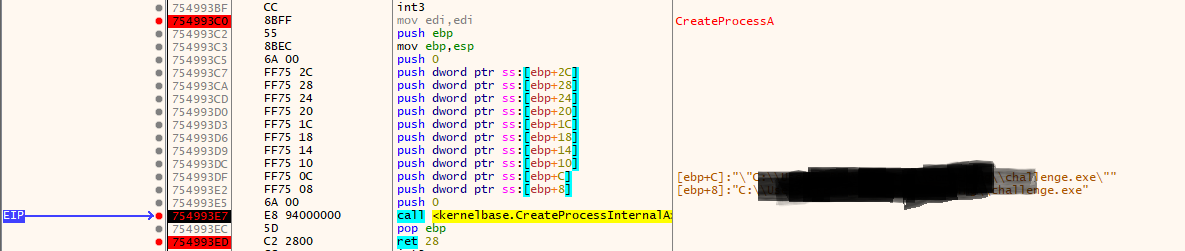 Breakpoint hit inside CreateProcessA
Register state at breakpoint
At the moment of the call, the registers are:
1
2
3
4
EIP : 754993E7  kernelbase.CreateProcessInternalA
EBP : 007EB77C
ESP : 007EB74C
EDX : "C:\Users\XXX\challenge.exe"
This confirms:
- We are inside
CreateProcessA - Arguments are already set up
- The stack frame is stable
At this point, arguments must be read via EBP, not ESP.
Locating dwCreationFlags
On x86, the argument layout for CreateProcessA inside the function is:
1
2
3
4
5
6
[EBP+08]  lpApplicationName
[EBP+0C]  lpCommandLine
[EBP+10]  lpProcessAttributes
[EBP+14]  lpThreadAttributes
[EBP+18]  bInheritHandles
[EBP+1C]  dwCreationFlags   ← target
Using EBP = 0x007EB77C, we dump memory around the stack frame.
Memory dump:
1
007EB78C  00 00 00 00 00 00 00 00 00 00 00 00 04 00 00 08
The bytes at offset EBP+1C are:
1
04 00 00 08
 Stack dump showing dwCreationFlags value at [EBP+1C]
Decoding the value
Interpreting the value as little-endian:
1
0x08000004
Breaking it down:
1
2
0x00000004 → CREATE_SUSPENDED
0x08000000 → CREATE_NO_WINDOW
The value of dwCreationFlags used by the malware is:
1
0x08000004
This confirms that the newly created process is intentionally paused so that its memory can be manipulated before execution resumes.
Q10 — Process Injection Technique
Question
The malware uses a process injection technique. What is its name?
Based on the execution flow observed throughout the analysis:
- A new process is created in a suspended state (
CREATE_SUSPENDED) - The original process image is unmapped
- Memory is allocated in the target process
- A payload is written into the target process memory
- The thread context is modified
- Execution is resumed
This sequence of actions corresponds to the following injection technique:
1
Process Hollowing
No further demonstration is required, as each step of this technique has already been confirmed in the previous questions.
Q11 — Payload Injection API
Question
What is the API used to write the payload into the target process?
Execution flow
After the malware finishes its initial setup and returns from RegisterClassExA, execution continues through a short sequence of Windows APIs that clearly indicate process injection activity.
The observed call flow is:
1
2
3
4
5
6
ReadProcessMemory
GetThreadContext
NtUnmapViewOfSection
VirtualAllocEx
NtWriteVirtualMemory
WriteProcessMemory
This sequence shows the malware preparing a remote process, allocating memory inside it, and then writing the payload.
Final write operation
Although both native (Nt*) and user-mode APIs appear in the chain, the actual user-mode API responsible for writing the payload into the target process is:
1
WriteProcessMemory
This is the definitive API that copies the malicious payload into the remote process address space.
This confirms the final stage of the process hollowing technique and completes the malware execution chain.
Conclusion
The Ransomed sample illustrates a classic multi-stage loader used in real malware: packed on disk, builds essential strings at runtime, allocates executable memory, executes shellcode, and compromises another process using process hollowing. By stepping through its behavior with x32dbg and validating observed API calls with scdbg, we reconstructed the full execution chain with confidence.